Given a specific branch, i’d love to be able to view much compute (Memory and CPU) is currently being used, as well as the ability to view metrics for Last 30 min, 1 hour, 1 day, etc (As a graph).
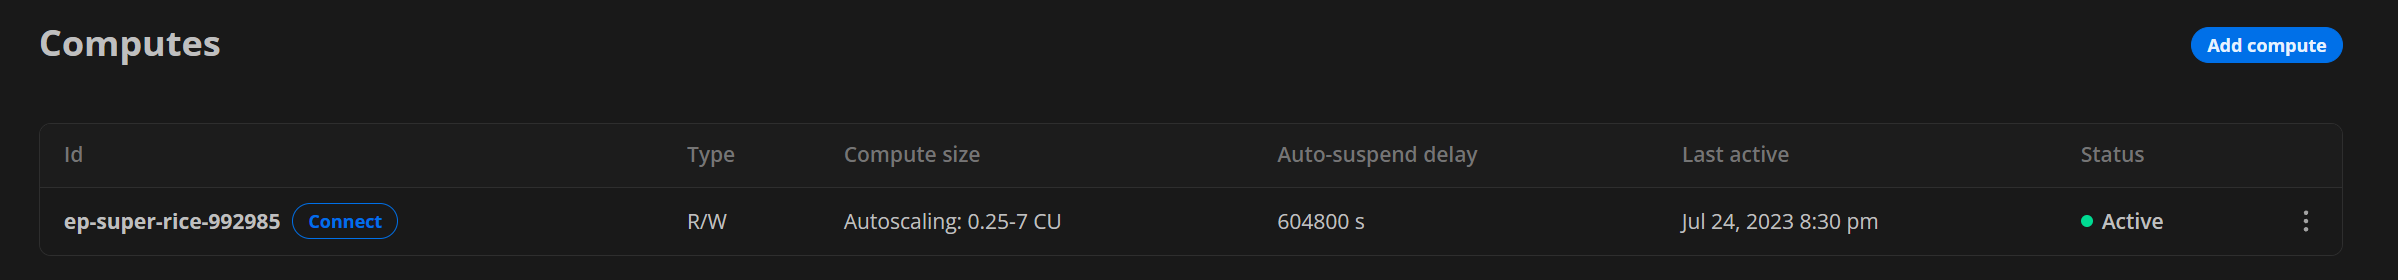
Where do I see how much compute size is being used/currently active? For example I can see that my auto scaling is set to 0.25-2CU, but what is my current compute size (if I want to look it up on the dashboard)?
I understand that it’s a Serverless product and these are things we shouldn’t have to worry about, but i’d still like to have some insight into usage/metrics ![]()
Note:
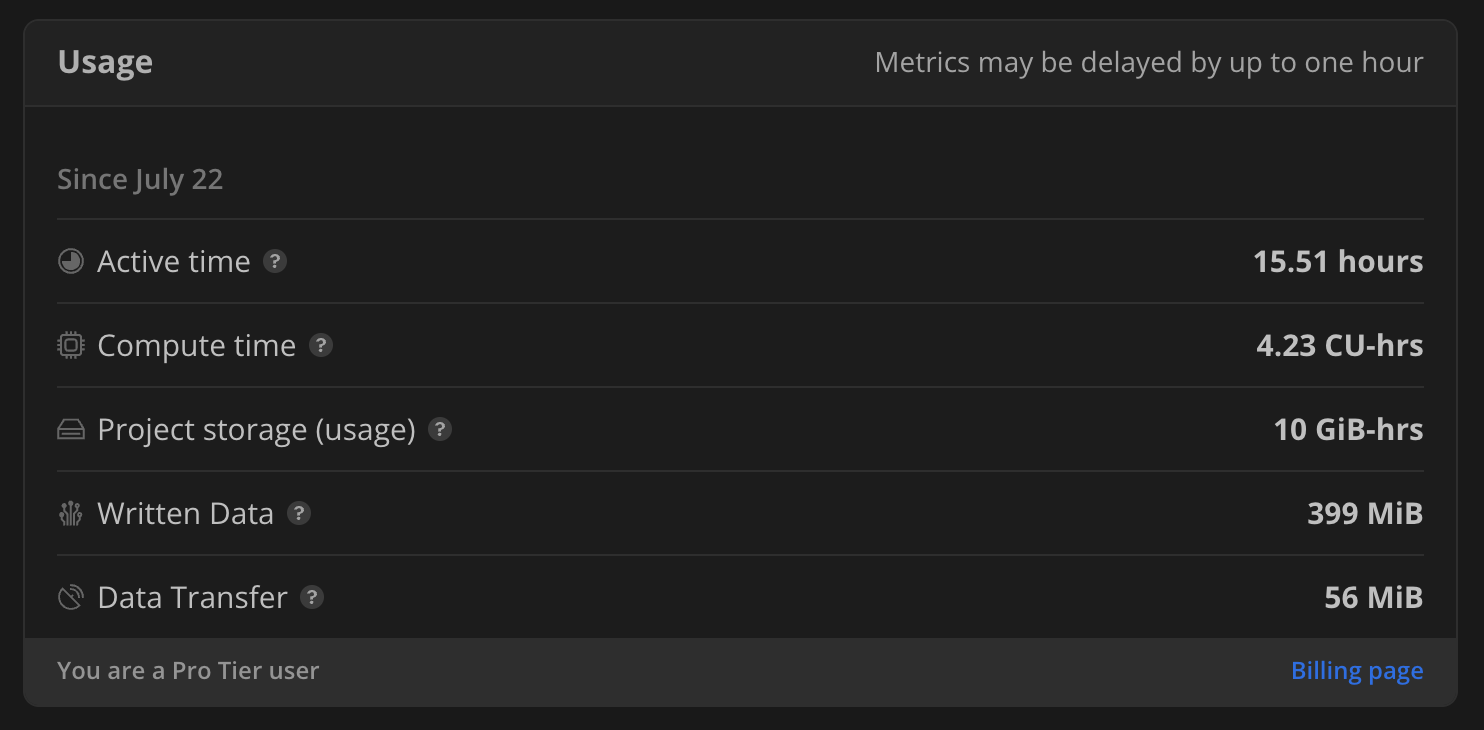
I wouldn’t necessarily call this “Metrics”. “Usage” yes, but definitely not metrics