So, I am currently on a free tier and developing a new application.
I am using Django 4.1+ version and followed guides to set up.
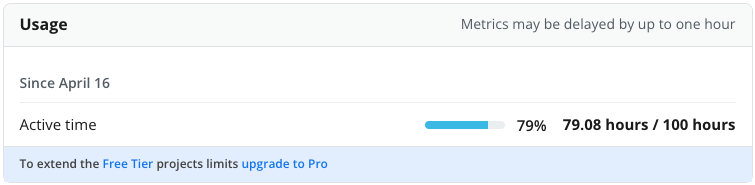
Now, I am using setting CONN_HEALTH_CHECKS = False, however, I still face an issue where a lot of my compute is just stale(meaning no actual DB requests are happening, I assume) and still shown as active in the neon.tech admin dashboard.
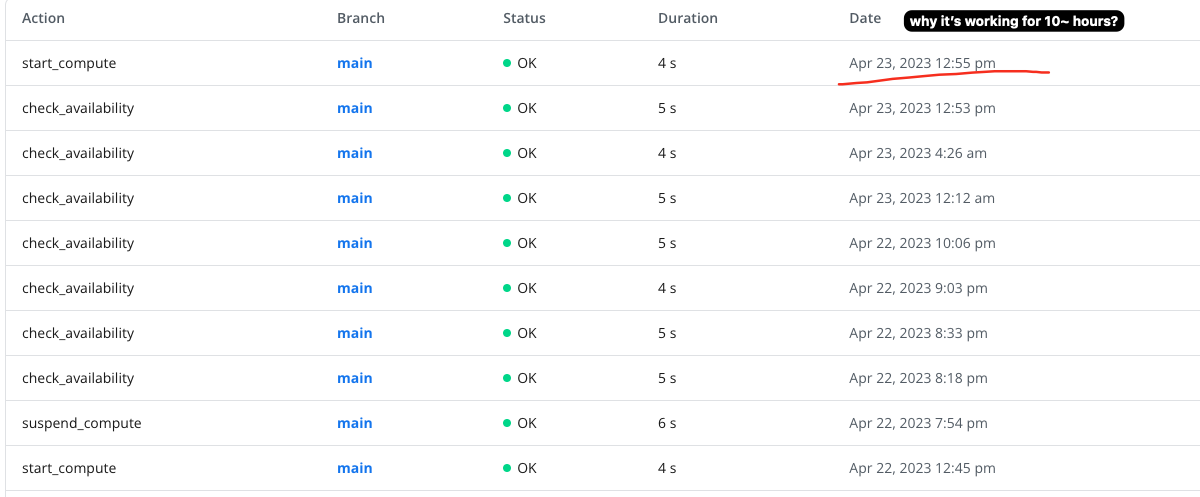
Also, here is the operations the way I see it from my admin dashboard:
I have one theory, where it might be the case, that I have a health check every 5 minutes, and it might be the case, that it triggers new connection to DB(for some reason).
Any django people who might help in debugging this issue? Don’t want to waste my compute while there is not much traction going on.
Weren’t able to attach 2 screenshots, but here is the second one:
One extra thing to note, is that it would be super useful for me to be able to suspend my compute, so I can debug this issue.
Some updates from me: I think I was able to pinpoint the culprit here, it was one of the services, that was connected to the database. Seems like service health check was not set up right – resulting in querying the database.
1 Like
More thoughts on how this process can be improved from the Neon DB side:
- Since I have multiple databases within the same project, it’s hard to understand which one is bringing the compute up. It would be awesome if you could associate a particular database with the start_compute event.
- On that note, I wonder if there’s an “audit logging” feature that could help me debug this further. I’m connecting an open-source project to the database and don’t have visibility into why some queries are running in the background (going to ask that on Github of this project). If there could be a feature that tells me the type of query starting the compute, it would help in my debugging tremendously.